How traceroute works
network
tools
Traceroute is a diagnostic program that will show route of the packets in the network.
When you request a HTTP site like this blog, you request will traverse network to the destination and server there will generate response for you. It is not guaranteed that every request you will send to the same website will follow the same route.
If you want to know which path that packet took then you will use traceroute.
Traceroute for you, for you and for you! Traceroute for everybody!
Pre
To understand this part you need knowledge of OSI model (maybe just transport and network layer will be enough)
-r-sr-xr-x 1 root wheel 37K 14 wrz 02:56 /usr/sbin/tracerouteFunny thing what the ‘s’ in permissions means. Maybe I will get on to that in my next post.
Dictionary
ARP - address resolution protocol
ICMP - internet control message protocol
RTT - round trip time
TTL - time to live
IP - internet protocol
UDP - user datagram protocol
How it works
Let’s get down to business - what’s going on when you type traceroute 3h4x.github.io
Request
Traceroute prepares UDP segments and sends it over the network to destination address.
What so special about that UDP segment is TTL. It’s value starts from one and will increase by 1 every three packets sent until destination reached or max TTL, whichever comes first.
Response
Segment will either get to the router(1), destination(2) or nowhere(3).
-
In first case router will inspect IP header and decrese TTL.
If TTL is 0 then our UDP segment is discarded and router sends TTL Exceeded ICMP message to source.
If TTL is greater than 0 the router forwards our UDP segment. -
In second case our UDP segment will generate ICMP message port unreachable
-
In third case there is no response. Traceroute program will hit the timeout after 30 seconds and print “*”
Back to traceroute
Traceroute prints destination address, max TTL and size of datagram in the first line.
Next lines are composed of TTL value, domain name, IP address and three values of RTT
Example
traceroute to wp.pl (212.77.98.9), 64 hops max, 100 byte packets

 1  192.168.8.1 (192.168.8.1)  1.783 ms  1.498 ms  2.006 ms
 2  jfkspo3.rev.pl (31.212.217.129)  2.379 ms  1.770 ms  1.928 ms
 3  z-ne-do-rtr2.rev.pl (88.65.40.1)  3.452 ms  3.123 ms  3.168 ms
 4  wp.plix.pl (195.182.218.204)  6.622 ms  6.373 ms  6.545 ms
 5  rtr2.rtr-int-2.adm.wp-sa.pl (212.77.96.69)  11.773 ms
    rtr2.rtr-int-1.adm.wp-sa.pl (212.77.96.65)  10.637 ms  10.719 ms
I have picked this example to show that routing is not static.
Everything can change and internet has a lot moving parts.
Look closely for output of traceroute. When segment with TTL = 5 was sent something strange happened.
Our packets were sent via two different routers with IP 212.77.96.69 and 212.77.96.65.
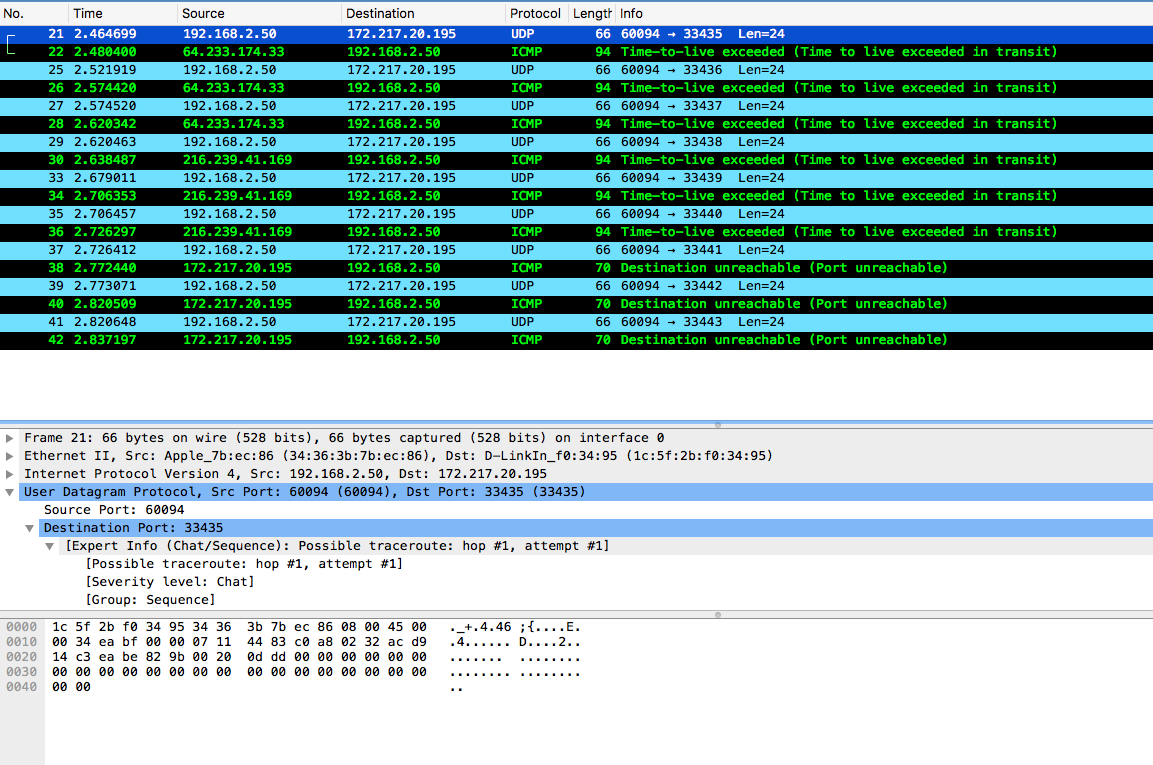
You can use wireshark to inspect traffic, example below:
Usage
Try some of the flags and check man page or --help.
- -d - Enable socket level debugging.
- -m max_ttl - Set the max time-to-live (max number of hops) used in outgoing probe packets
- -P proto - Send packets of specified IP protocol like UDP , TCP , GRE and ICMP
- -S - Print a summary of how many probes were not answered for each hop.
- -v - Verbose output. Received ICMP packets other than TIME_EXCEEDED and UNREACHABLEs are listed.
Other useful tools
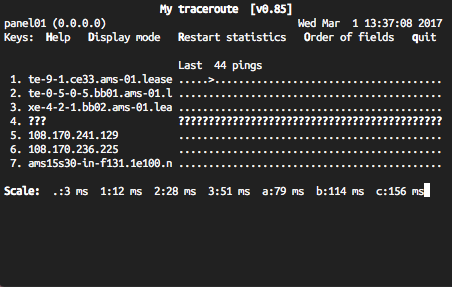
One of my favourites is mtr! You get a tool in which you can change many options while the program is running.
Notice time of execution :D
Other is tracepath - traces path to a network host discovering MTU along this path.
Conclusion
Traceroute is one of the tools that you should be familiar with.
Knowing how it works on network level will give you valuable insight into debugging potential problems.
3h4x