seo-tools — how I keep analytics and SEO across multiple sites from becoming a second job
seo
analytics
nextjs
google-search-console
ga4
dashboard
open-source
Running more than one site creates a specific kind of friction that sneaks up on you. You deploy something, fix a meta tag, add a page — and then a week later you’re opening four GA4 tabs, clicking through Search Console for three different properties, and manually checking whether robots.txt still exists after that last deploy. None of it is hard. All of it adds up. I built seo-tools to collapse that down to one place, and I’ve been running it daily ever since.
The actual problem it solves
The issue isn’t lack of data — Google gives you plenty. The issue is that it’s scattered. GA4 for traffic. Search Console for search performance. Manual curl or browser checks for SEO health. When you have multiple sites, you multiply that by N. You end up either ignoring most of it or spending more time checking dashboards than actually fixing things.
What I needed was a single dashboard that answers three questions every morning:
- Is everything healthy? (Did a deploy break something?)
- What should I fix next? (Where are the actual SEO gaps?)
- Is anything quietly dying? (Pages losing traffic before it becomes a real problem)
seo-tools answers all three.
How I use it
The first thing I open each morning is the Overview — a single view with GA4 and Search Console data aggregated across all my sites. Users, sessions, page views, SC clicks and impressions, trend arrows showing week-over-week movement, traffic sources, and a per-site breakdown in one table.
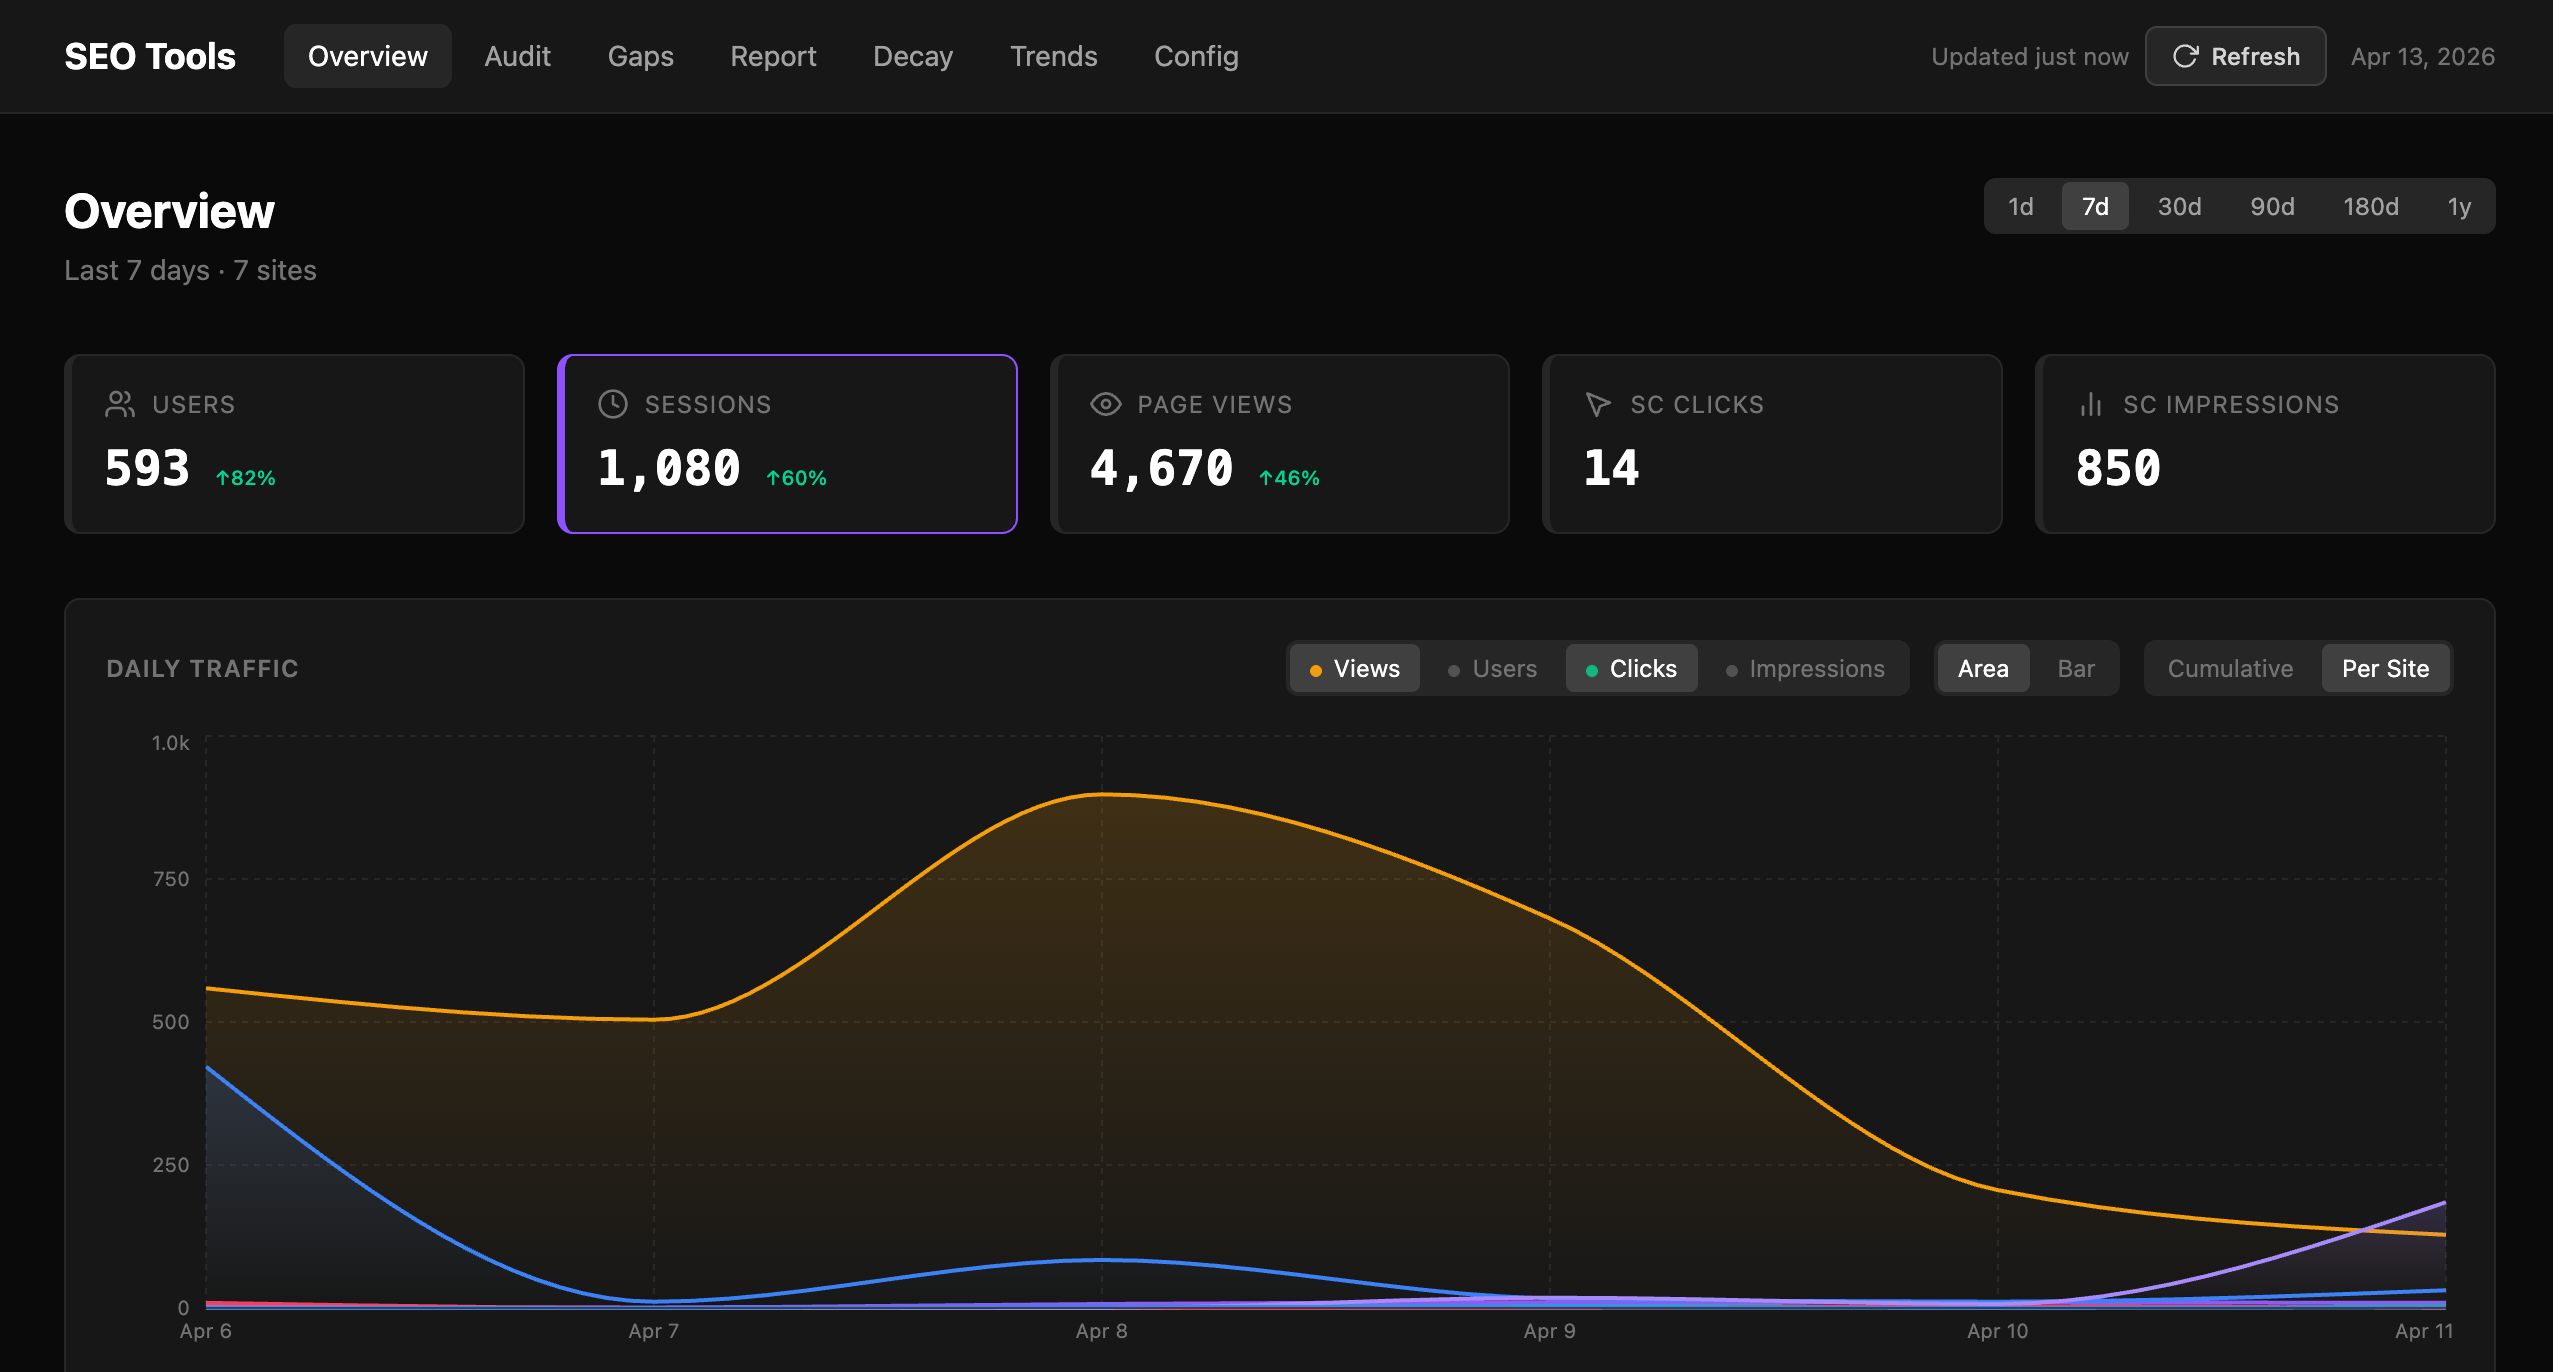 Overview: all sites in one table — users, sessions, bounce rate, SC position, 7-day trend arrows. No tab switching.
It takes about thirty seconds to confirm that traffic is moving in the right direction and nothing has fallen off a cliff. If something looks wrong — say a site’s bounce rate jumped or SC clicks dropped — I drill into that site from the same page.
Audit: catching broken things before Google does
The Audit page runs live checks against every site on each load (with a 30-minute cache so it doesn’t hammer anything). For each site it checks:
robots.txt— exists, has aSitemapdirective- Sitemap — valid XML, URL count, recent
lastmoddates - Meta tags — fetched as Googlebot UA:
<title>,<meta description>,og:title,og:image,og:description,twitter:card, canonical, JSON-LD - OG image — actually fetches the URL, validates it’s a proper PNG at 1200×630
- TTFB — time to first byte (pass under 800ms, warning up to 2s, fail above)
- Image SEO — alt text coverage, lazy loading
- Internal links — flags pages with fewer than 3 internal links
Each site gets a health score and a “checked X ago” timestamp so I know whether I’m looking at live data or a cached result. When I deploy something, I hit Refresh and watch the checks run.
The thing I use most here: after any significant deploy I check the audit immediately. It’s caught broken OG images (the URL path changed), missing meta tags (a template didn’t render server-side), and a TTFB regression (a new API call on the homepage blocking render) before any of those became a ranking problem.
Gap Analysis: a prioritized action list
The Gaps page compares each site against SEO best practices and generates a prioritized recommendation list — High, Medium, Low — grouped by category: Crawlability, Content, Social, Indexing, Performance, Security.
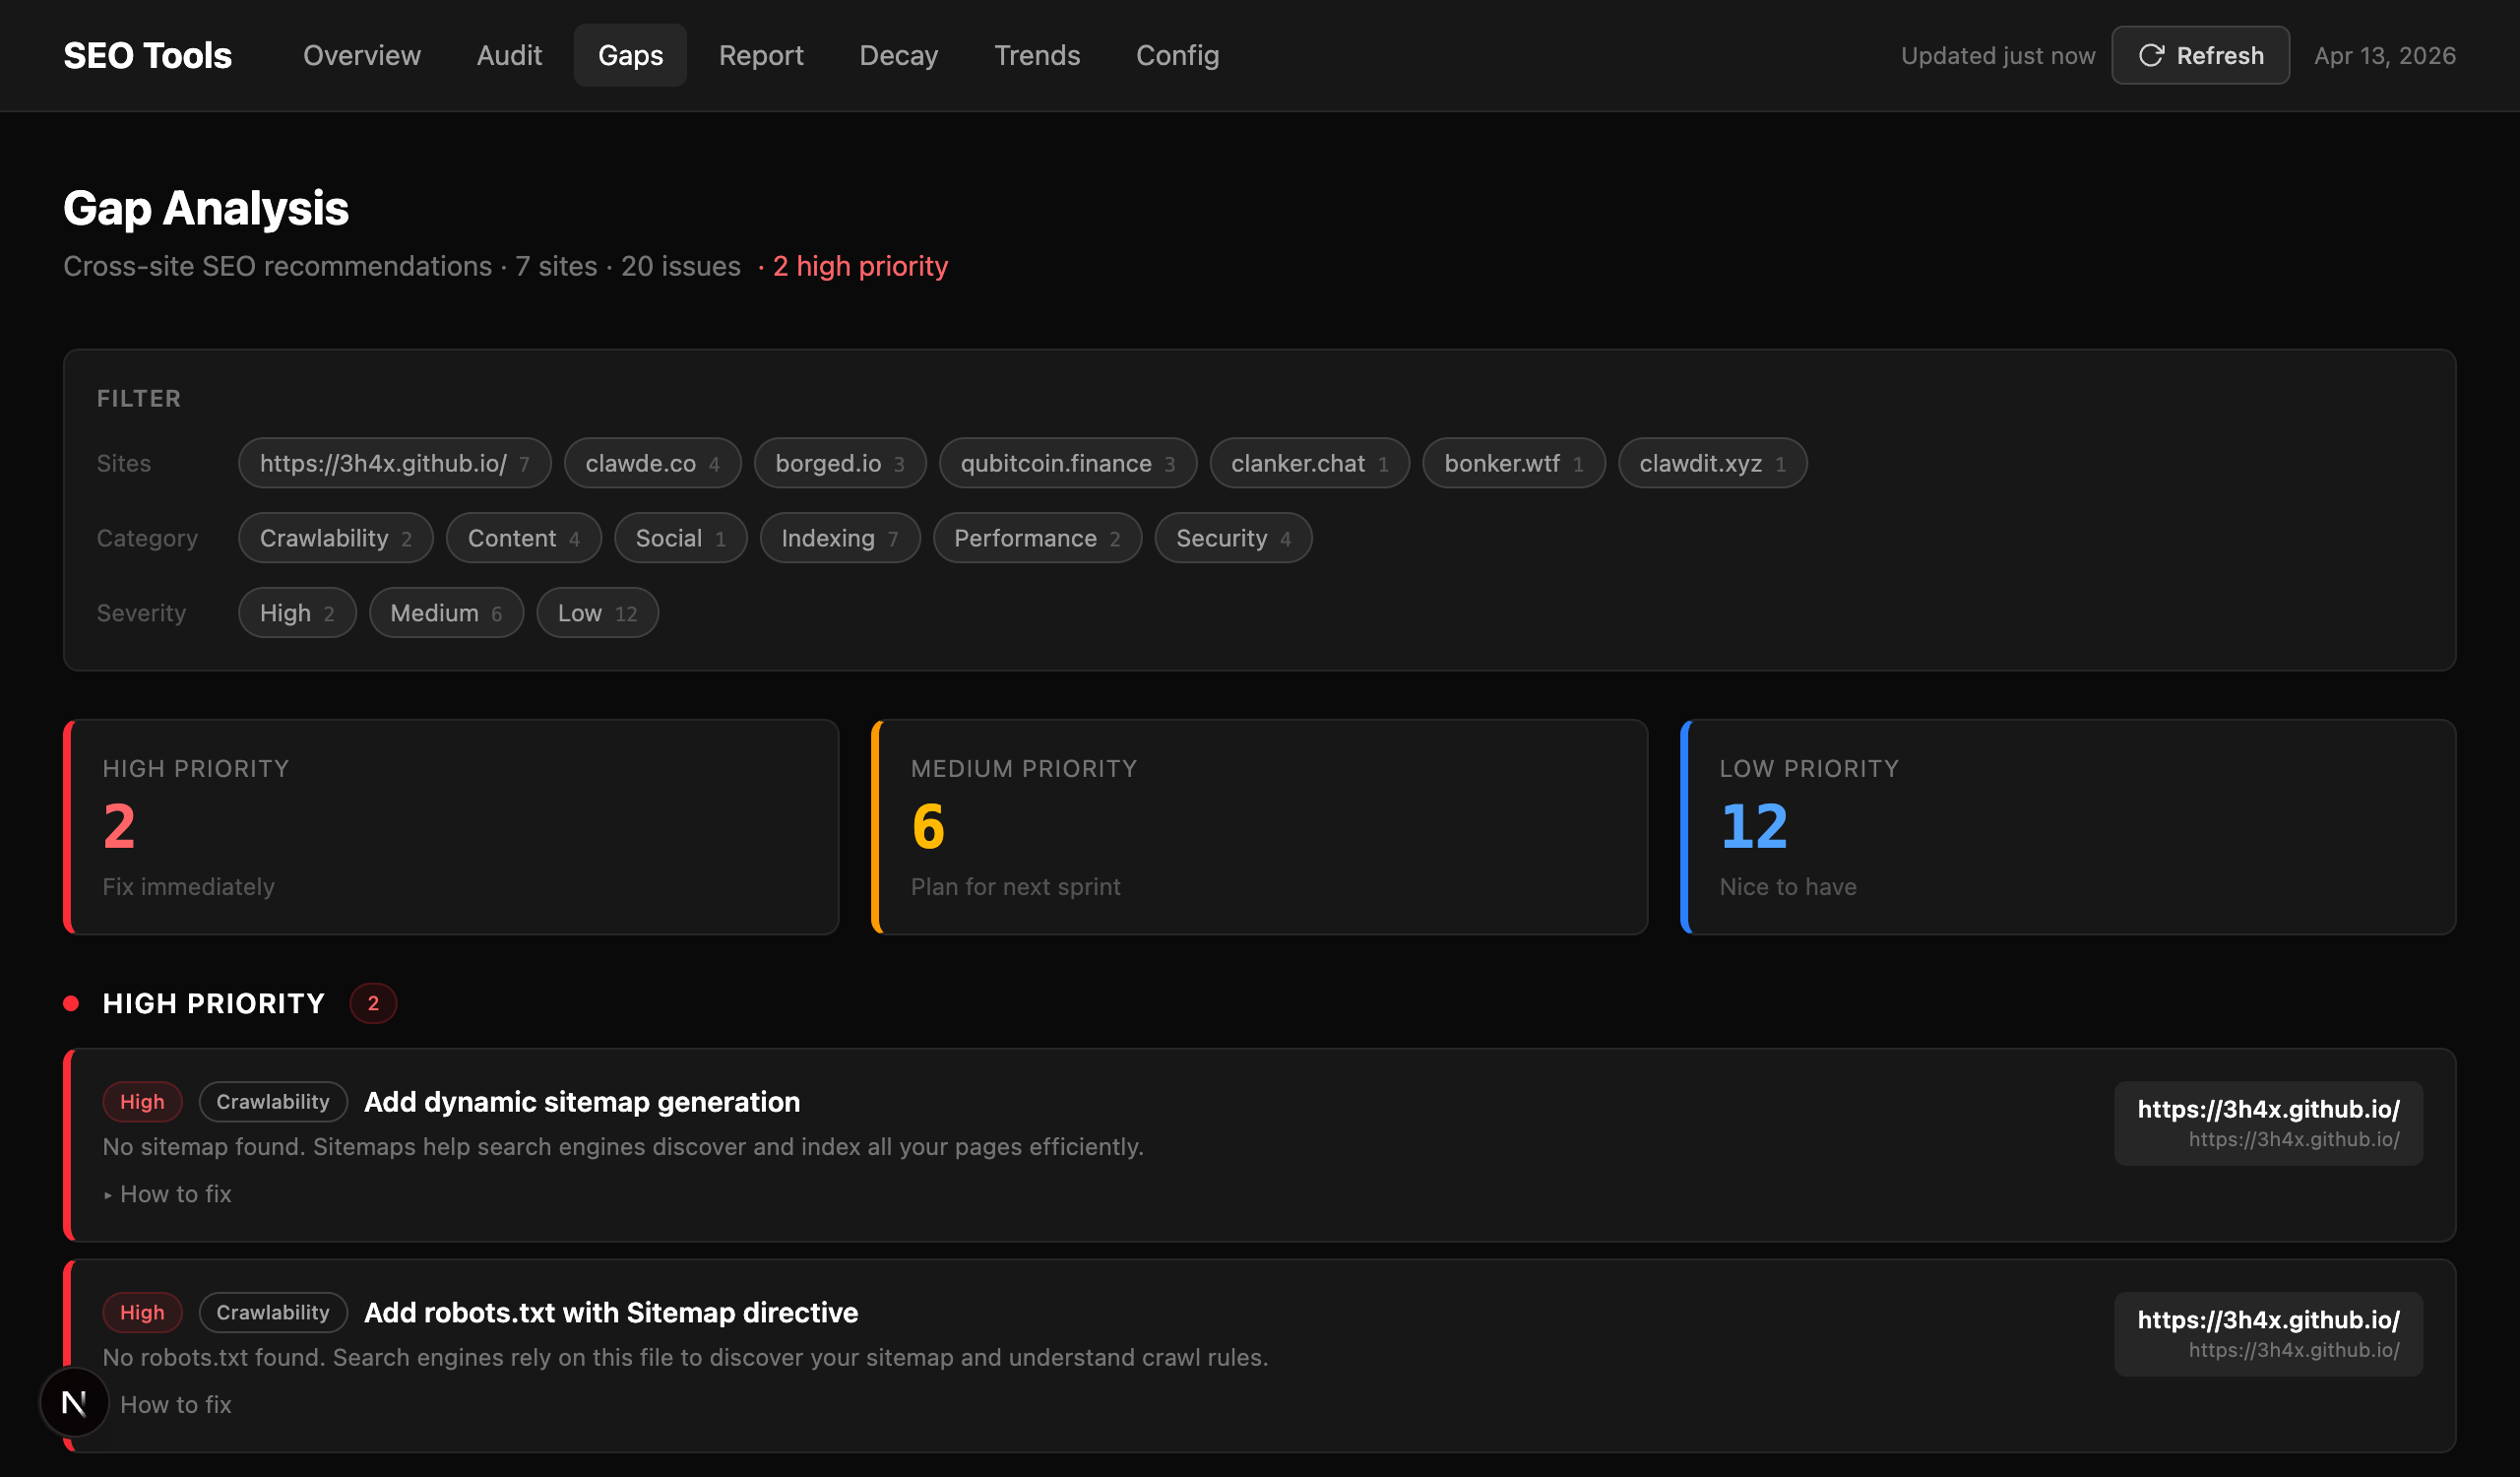 Gap Analysis: 20 issues across 7 sites, filtered and ranked. Each recommendation has an expandable “how to fix” section.
Each recommendation tells you what’s missing, why it matters, which site it affects, and has an expandable “How to fix” section with concrete steps. High-priority items are things like missing robots.txt or no sitemap — stuff that actively hurts crawlability. Medium is things like missing HSTS headers or no dynamic OG images. Low is nice-to-haves like IndexNow pings and lazy loading.
I use this as my SEO backlog. When I have an hour to spend on a site I open Gaps, filter to that site, and work top to bottom. It’s a much better use of time than guessing what to fix.
Content Decay: find dying pages before they’re dead
The Decay page pulls Search Console data for two consecutive periods and flags pages where clicks or impressions dropped significantly. It labels each one MODERATE or SEVERE with exact numbers — how much clicks dropped, how much impressions changed, current position.
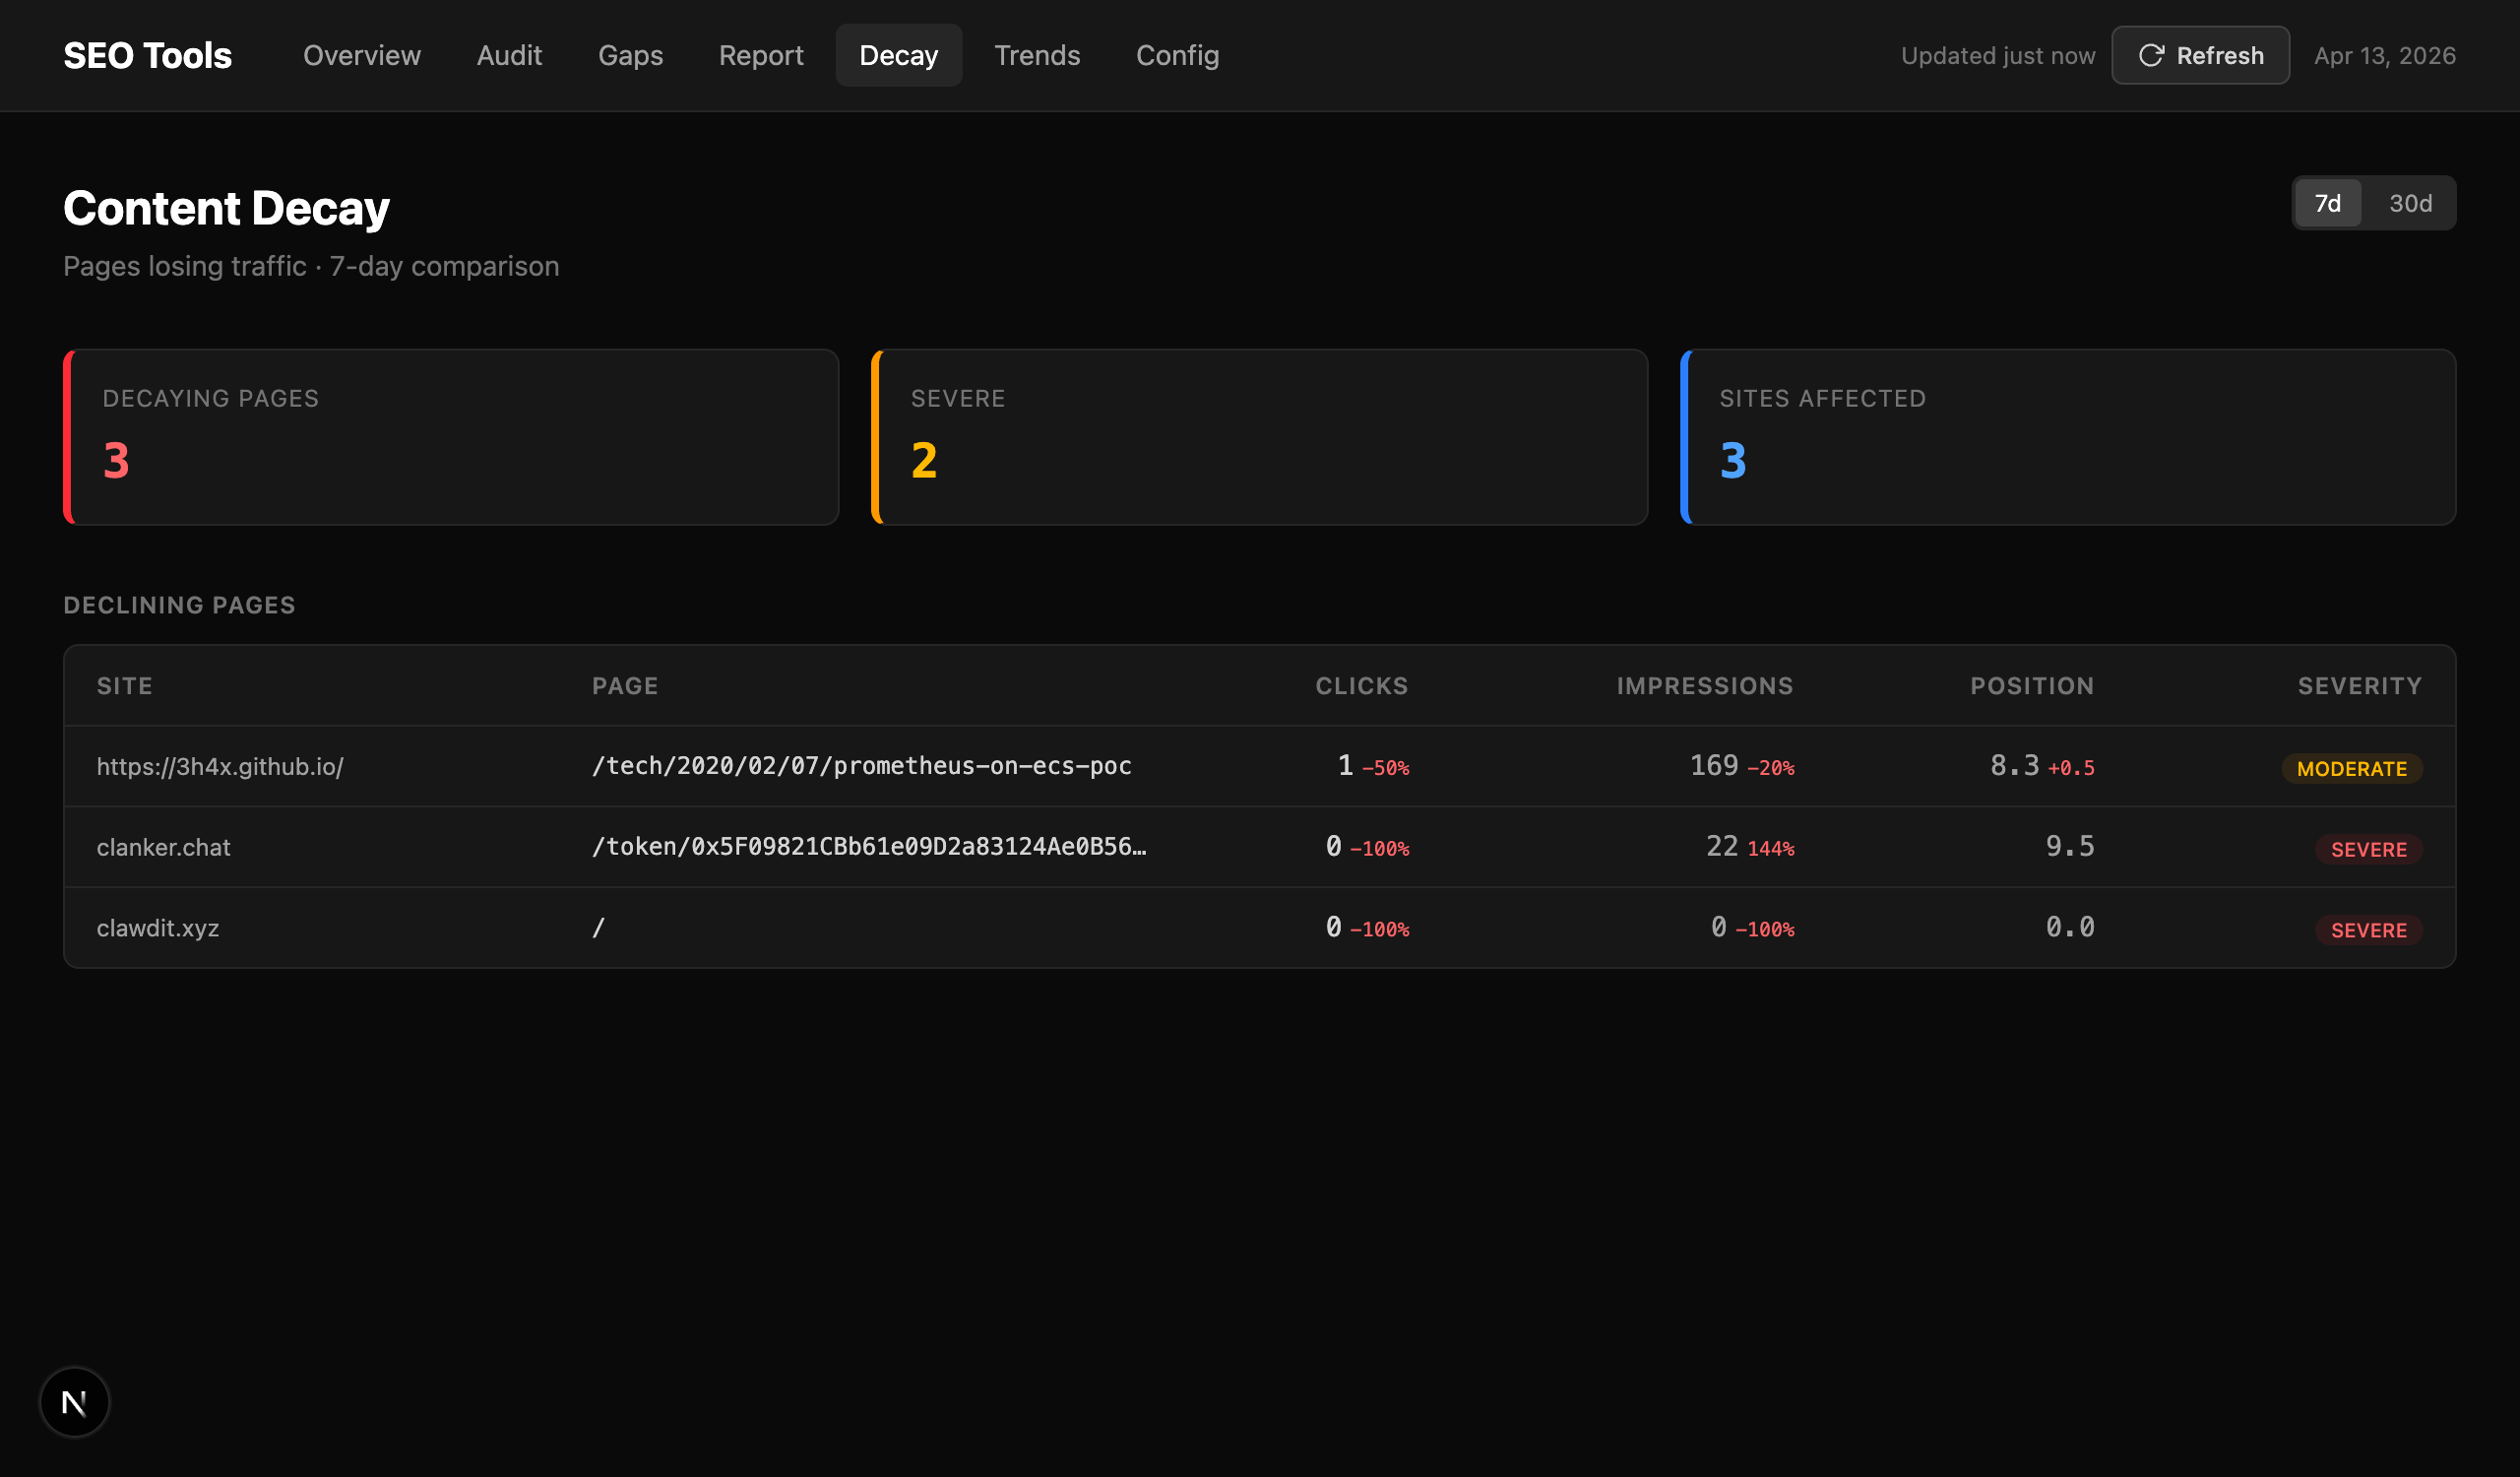 Decay: pages losing Search Console traffic. Severity rating, click and impression delta, current position.
This is the one I check less often but value most when something’s wrong. A page dropping from position 4 to position 12 over a month is invisible in the normal GA4 view — you’re not going to notice it in aggregate traffic numbers until it’s already costing you. Decay surfaces it while there’s still time to update the content, improve the page, or investigate whether a competitor just outranked you.
One service account, all sites
Setup is a Google service account — one key that gets added as a user to each site in Search Console and GA4. After that, seo-tools auto-discovers all your GA4 properties via the Admin API and stores everything in SQLite. Sites are managed through the Config tab UI; no domains or property IDs in source code.
The easiest way to run it is Docker. A pre-built image is published to GitHub Container Registry:
# docker-compose.yml
services:
  seo-tools:
    image: ghcr.io/3h4x/seo-tools:latest
    container_name: seo-tools
    restart: unless-stopped
    ports:
      - "3031:3031"
    volumes:
      - ./data:/app/data
    environment:
      - GOOGLE_SA_KEY_JSON=${GOOGLE_SA_KEY_JSON:-}
GOOGLE_SA_KEY_JSON='{"type":"service_account",...}' docker compose up -d
The data/ volume is where SQLite lives — snapshots, cache, site config. Mount it so data survives container restarts. The GOOGLE_SA_KEY_JSON env var is optional at startup; if you leave it out, you can paste the key in the Config tab after first boot.
The Config tab has a “Discover sites” button that pulls all SC and GA4 properties the service account can see and imports them automatically. After that you have a working dashboard.
For historical trends, I run a daily snapshot via cron:
pnpm seo snapshot # stores SC + GA4 data in SQLite for trend tracking
The Trends page charts those snapshots over time — audit score, SC clicks, GA4 sessions — so you can see whether your improvements are actually moving the needle week over week.
Why self-hosted
I looked at SaaS SEO tools. Most of them are expensive, give you a lot of data you don’t need, and don’t integrate GA4 and Search Console together in a way that maps to how I think about problems. More importantly: I run sites that aren’t exactly standard web properties. I needed something I could customize — add new checks, change how gap analysis works, integrate with my own deployment pipeline. A self-hosted Next.js app you can modify beats a SaaS dashboard you can’t.
The repo is at github.com/3h4x/seo-tools. Dark theme, no cloud, runs on any machine with Node and a Google service account.
3h4x